Theoretical Infrared Spectroscopy
We previously looked at vibrational properties of molecules for a number of small molecules. Today, I’ll look at computing infrared spectra of some related molecules. What is the difference between simply looking at vibrational properties versus IR absorption or transmission? Well, while each non-linear, polyatomic molecule has 3N-6 vibrational modes, where N is the number of atoms, only a certain number of these modes will be IR active.
Why infrared wavelength light? Molecules absorb photons when the energy of those photons matches the difference between two vibrational states. The separation in energy of most vibrational states is around 0.005-0.5 eV, making infrared light with wavelengths in the vicinity of 2.5 micron most suitable for exciting vibrational levels in molecules.
What makes a mode IR active? The vibration of the bond must change the permanent electric dipole or charge distribution of the molecule in order for the absorption to be non-zero. Therefore, more symmetric molecules have fewer and less intense IR modes. Also recall that as a potential gets steeper and steeper the vibrational levels often increase in their separation. Therefore, we expect that frequencies of triple bonds are higher than double bonds, double bonds higher than single bonds, and so on.
Now, let’s get started on the calculations part of our tutorial. Today, we’ll calculate the IR spectrum of a few prototypical molecules using the latest version of Quantum-ESPRESSO (v5.0.3 as of this writing).
What you need in your Quantum-ESPRESSO distribution: pw.x, ph.x, dynmat.x, and pseudopotentials for C, H, N, F, Cl, Br, and I. In order to make ph.x and dynmat.x, be sure to download the phonon code separately and do ‘make ph’ or ‘make all’. I’ve bundled the pseudopotentials you’ll need here.
We’ll also need starting structures for all of the molecules we will study today: fluoro-, chloro-, bromo-, and iodomethane as well as benzen and pyridine. In a later tutorial, I will go over how we can build these structures quickly using SMILES and OpenBabel. For today, you can either download the structures here or my SMILES to structure script here if you have access to OpenBabel already. I’ll go over how this script works in next month’s tutorial. If you download the structures directly, be sure to unzip the archive and place them in the same root directory as the rest of the scripts outlined below.
Once we have the structures ready, we still have to do a few steps for each (our methyl script and benzene/pyridine script do all of these steps together for each molecule. All you have to do is assemble the pieces together and specify the location of your executables):
1) Structural relaxation with pw.x: Yes, we’re starting from structures that are a pretty good guess, but they may not be the lowest energy structure for a given set of pseudopotentials, exchange-correlation functional (in this case, PBE-GGA), and cutoff. Note: you’ll want to benchmark your cell size and cutoff and compare results of different functionals in detail for true production runs (for examples of this see the previous tutorial on convergence). If you skip this step, you can expect to see small negative or imaginary frequencies show up. Most of you are familiar with structural relaxations so I won’t go into any further detail here. On a single processor, these calculations should take a few minutes each.
2) Calculate the normal modes with ph.x: Here we are mostly using defaults, which includes a threshold on the phonons, setting amass(i) = 0 for each species so the mass from the periodic table is used. An important piece to note is trans=.true. must be on so transition probabilities are computed. And fildyn defines the dynamical matrix file.
3) Calculate the IR cross sections with dynmat.x: Here we obtain the IR cross section using the dynamical matrix computed in #2 as input.
4) Plot a broadened spectrum: We’re going to automatically apply a 10 cm-1 broadening to each peak to give a little more “realism” to our spectrum in the script spectrumplot.py. You’ll need to run this somewhere that has python with numpy and matplotlib. You can modify the broadening manually at the commandline by manually running python spectrumplot.py <broadening in cm-1>
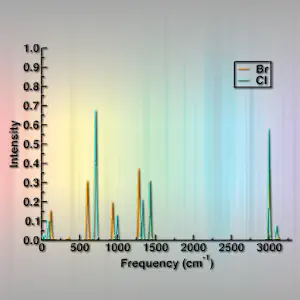
So, let’s look at some results. First, let’s look at the fluoromethane,chloromethane,bromomethane, and iodomethane results together. I’ll grab all the “*.finir.dat” files generated by spectrumplot.py and plot them using xmgrace. You can use your preferred software or hack the matplotlib code at the bottom of spectrumplot.py to use matplotlib if you prefer.
CH3X, X=F,Cl,Br,I results:
What do you notice as you go down the periodic table?
What happens to the frequencies for different halides?
Do these trends follow what you’d expect about the potential energy surface?
Can you guess based on available tables of typical frequencies what the assignments should be for each peak?
Now, let’s look at the benzene and pyridine results:
Here, we can see a much richer IR spectrum for pyridine because it is lower symmetry than the benzene molecule.
Does this make sense in terms of what you know about vibrational modes and IR spectroscopy?
What about relative intensities?
I hope you enjoyed this tutorial and that I’ve helped you to learn how to calculate IR spectra and automate the procedure of data collection! If you have any questions, please email me.